What happens to a dosimeter’s data after the plane lands
A detector comes off a plane
In the cockpit of an airliner, close to the pilots, there is a small aluminium box that no passenger will ever see. It is fixed to the aircraft and has been flying for months. It has no screen and no buttons, and it asks nothing of the crew.
Today a scientist comes on board. The box itself stays where it is. They pull a ribbon on its front panel and a drawer slides out: the part that holds the battery and all the recorded data. A fresh drawer goes in straight away, so the measurement carries on without a gap.
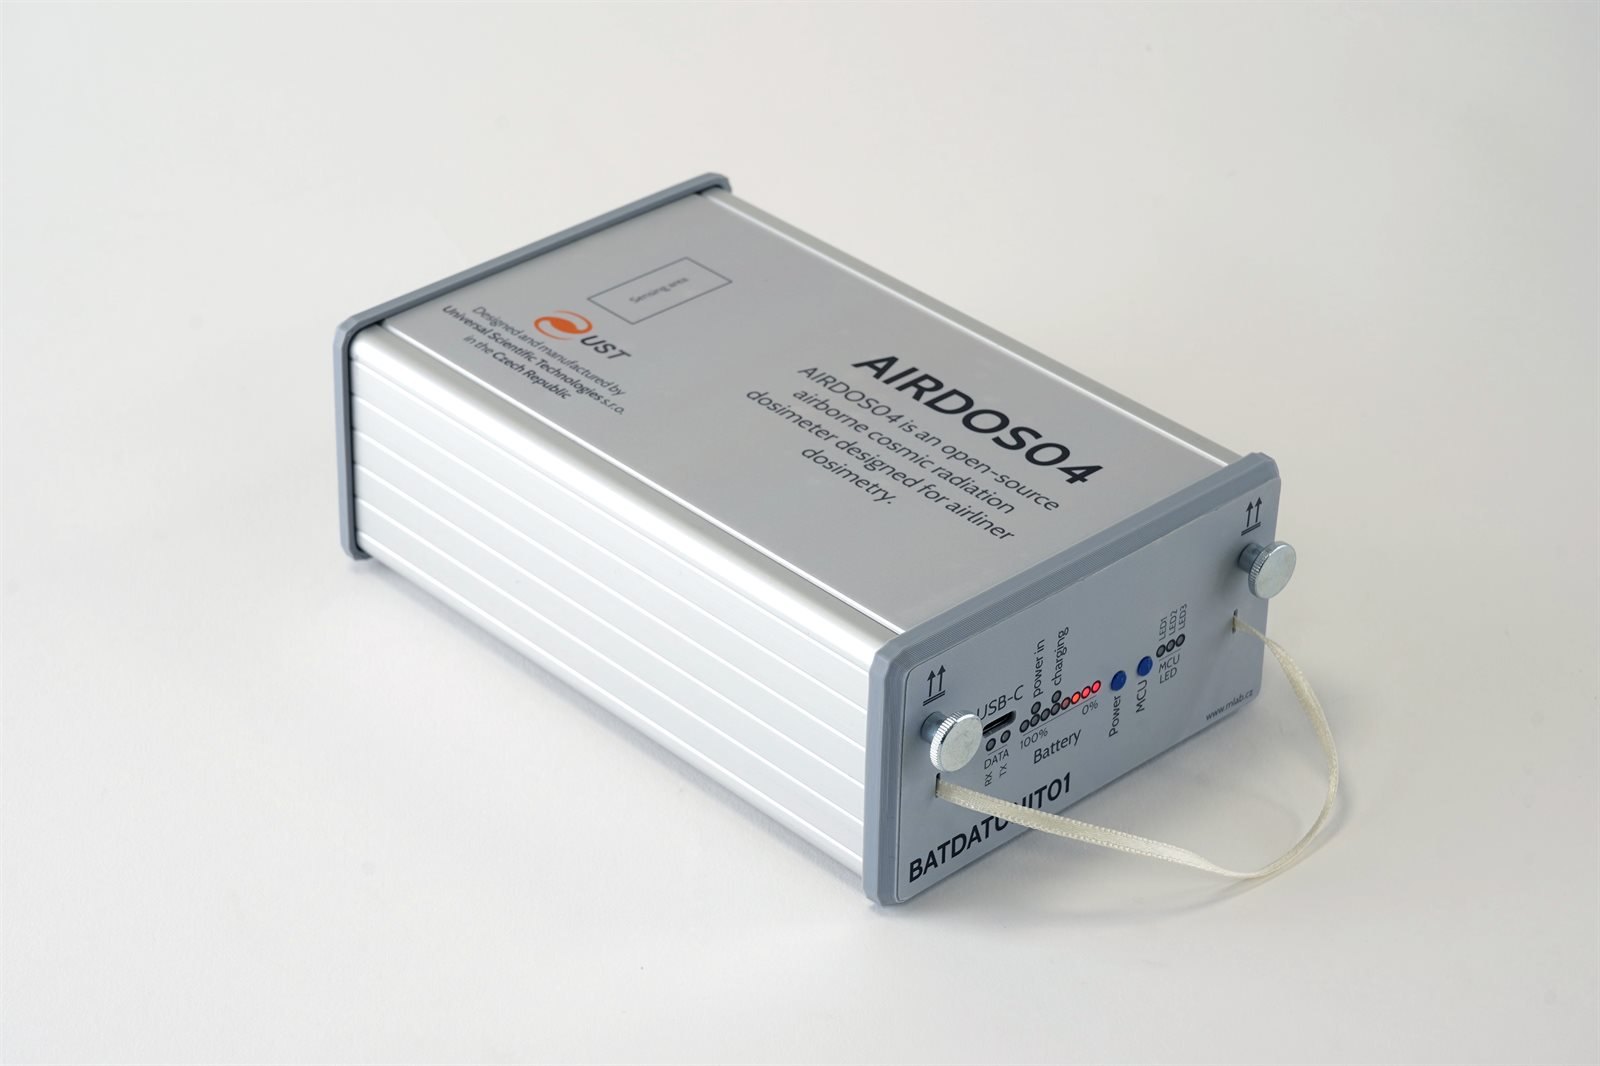 AIRDOS04, an open-source dosimeter from the AIRDOS family, built to fly on airliners. The drawer with the battery and the data pulls out at the front.
The scientist leaves with the old drawer. On it are a few gigabytes of data: a record of the radiation the aircraft has flown through. Its battery has lasted for months.
That leaves two questions.
- Why would anyone fly a dosimeter around the world?
- And what happens to those gigabytes next?
Why measure radiation on a plane
At cruising altitude there is far less atmosphere overhead to shield an aircraft from cosmic radiation. How much gets through depends on altitude, latitude and what the Sun is doing. A passenger hardly notices: ten cross-country round trips a year add up to about 0.4 millisieverts. For the people who work on board it is a different sum. Aircrew are estimated to receive 3 to 6 millisieverts every year, for an entire career.
In August 2026 a study in JAMA Internal Medicine looked at what that might mean. The authors went through nearly 13 million US death certificates from 2020 to 2024, covering 503 occupations. Flight attendants had the highest share of deaths from radiation-related cancers, about 6.9 percent, and pilots the second highest, 6.7 percent. The story made it to CNN. Death certificates show a link, not a cause, and the authors name cosmic radiation as a possible explanation, not a proven one.
Two months earlier, a report from the US National Academies had described the other half of the problem. Flight crews receive some of the highest occupational radiation exposures in the country, yet monitoring is “neither required nor formalized”. Doses are estimated with computer models.
Models do this well, but a model only contains what its authors knew to put in. It is worth testing against real measurements, because a measurement also picks up anomalies the model does not account for. One anomaly we do know about is the South Atlantic Anomaly, a region over South America and the southern Atlantic where the Earth’s magnetic field is unusually weak and lets radiation reach lower than it does elsewhere. The ones nobody has described yet can only be found by measuring.
That is why the box is in the cockpit: it records what the radiation on a given flight really was, so that the calculations can be compared with it. The comparison only works if the measurements can be found again, together with the flight time and trajectory they belong to. That is the job of DOSPORTAL.
Files and scripts
Back at the desk, the drawer is plugged in and the data is copied off. Then the work starts, and for a long time it looked the same every time.
Each type of detector writes its own format, so each one needs its own script to read it. The script is written for the measurement at hand, by whoever needs the result. It works, and then it sits in a folder on someone’s laptop. The next campaign uses a different detector, a newer firmware or a different person, and the script gets written again.
The measurement alone is not enough either. To make sense of it you need to know where the aircraft was, and that comes from somewhere else: flight tracks downloaded by hand from one of several services, each with its own format and none of them with every flight. That is a second set of scripts.
None of this was in one place. There have been attempts to change that: CR10, a database built around a single type of detector, and EDNA, which set out to extend it to other dosimeters. Neither grew into the shared place where measurements from every detector end up, and the scripts stayed.
What DOSPORTAL is
DOSPORTAL is a web application that runs in the browser. You upload the file from a detector, and the portal reads it, checks it, stores it and draws it. Next to the measurements it keeps a record of the detectors that made them. It is built for the researchers who analyse the data, the technicians who look after the instruments, and the partner institutions they share the results with. Under the hood it is a Django backend with a React frontend; the files live in object storage and the database keeps track of what they are.
The easiest way to explain what that gives you is to look at one flight.
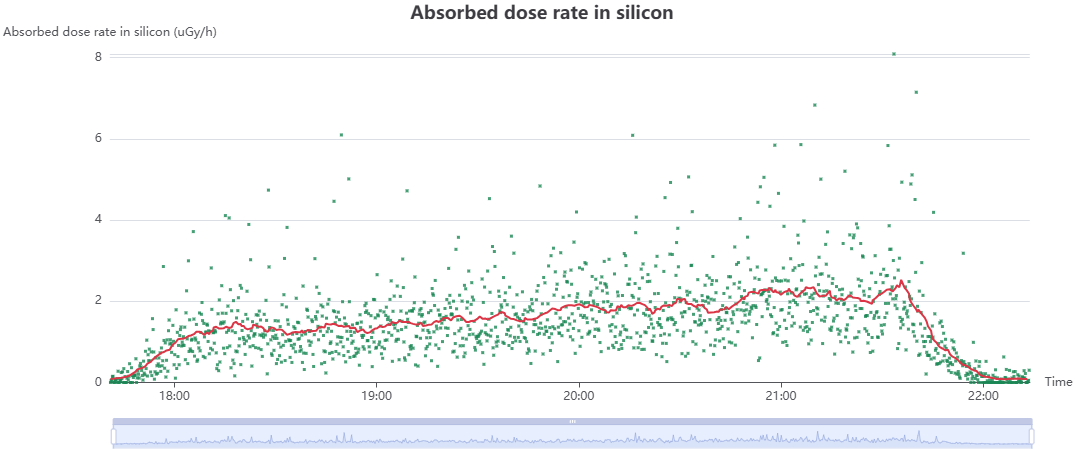 Absorbed dose rate during one flight. Each dot is one exposure of about ten seconds, the line is a moving average over 50 of them.
This is the dose rate the detector recorded over about four hours. It climbs after take-off, keeps rising slowly through the cruise and drops away on descent. The detector also sorts every event it registers into channels by the energy deposited in its sensor, so the portal can show the spectrum for the whole flight:
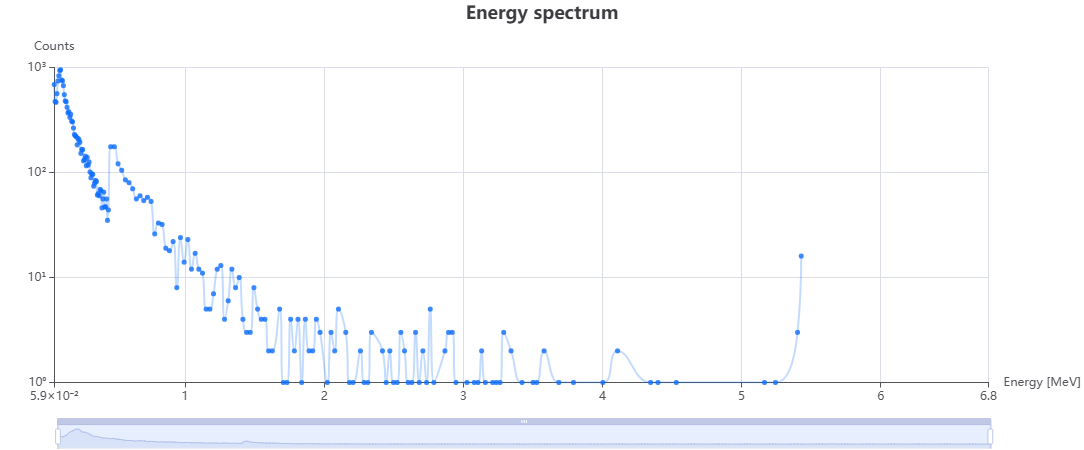 Energy spectrum of the same flight. Most particles deposit very little energy, a few deposit a lot.
Both charts come from the detector alone, with no script written for the occasion. How each quantity is calculated is described in the DOSPORTAL documentation.
Matching dosimeter data to flight trajectories
The two charts above tell you how much radiation there was and when, but not where. The detector does not know its own position, and by the time its drawer is collected it has been on board for a month or longer. In that time the aircraft may have flown all over the world, so working out where it was at any given moment is hard. The trajectory of each flight has to come from elsewhere and be matched to the measurement. DOSPORTAL does that:
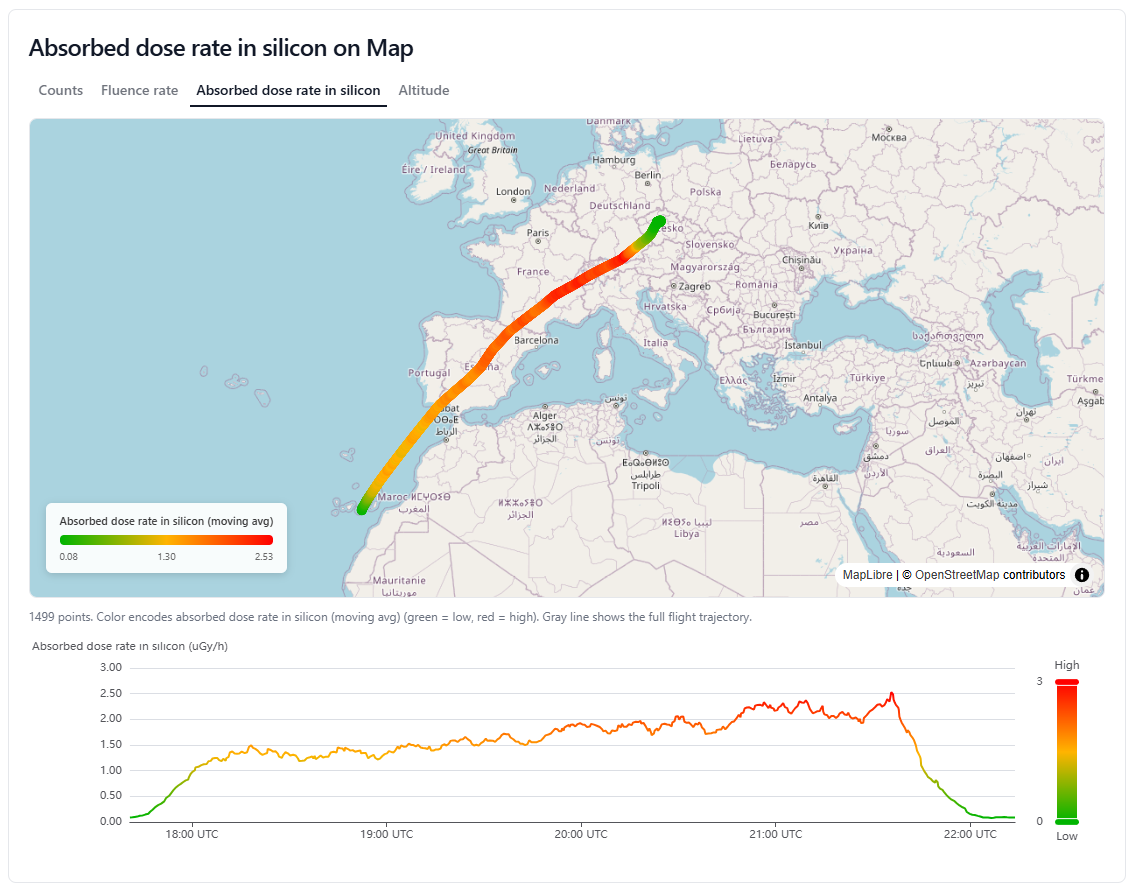 The same measurement on a map. The colour of the track is the dose rate at that point of the flight.
The trajectory brings altitude with it, which may answer a question the first chart left open: why did the dose rate keep rising during the cruise?
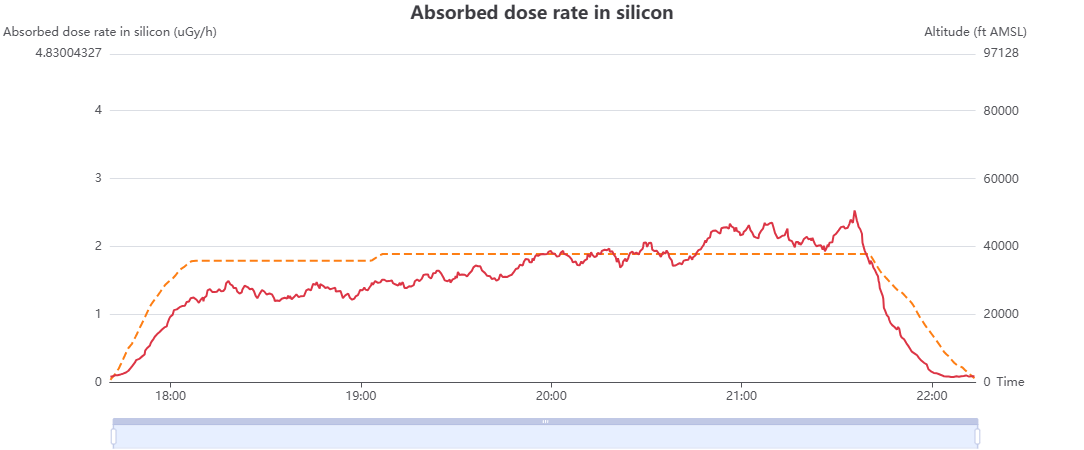 Absorbed dose rate (solid line) against flight altitude (dashed line).
The aircraft reached its final cruising level shortly after 19:00 and stayed there, yet the dose rate went on rising for another two and a half hours. Altitude cannot explain that, but the map can: the aircraft was flying north from the Canary Islands to central Europe, and the radiation grew with latitude along the way.
Getting here was a challenge of its own, and it is one we consider solved. As more organisations join, the list of trajectory sources and formats we support will keep growing. If there is interest, we will write about that part separately.
Shared measurements and a global map
A single flight is a nice picture. The value is in having many of them side by side.
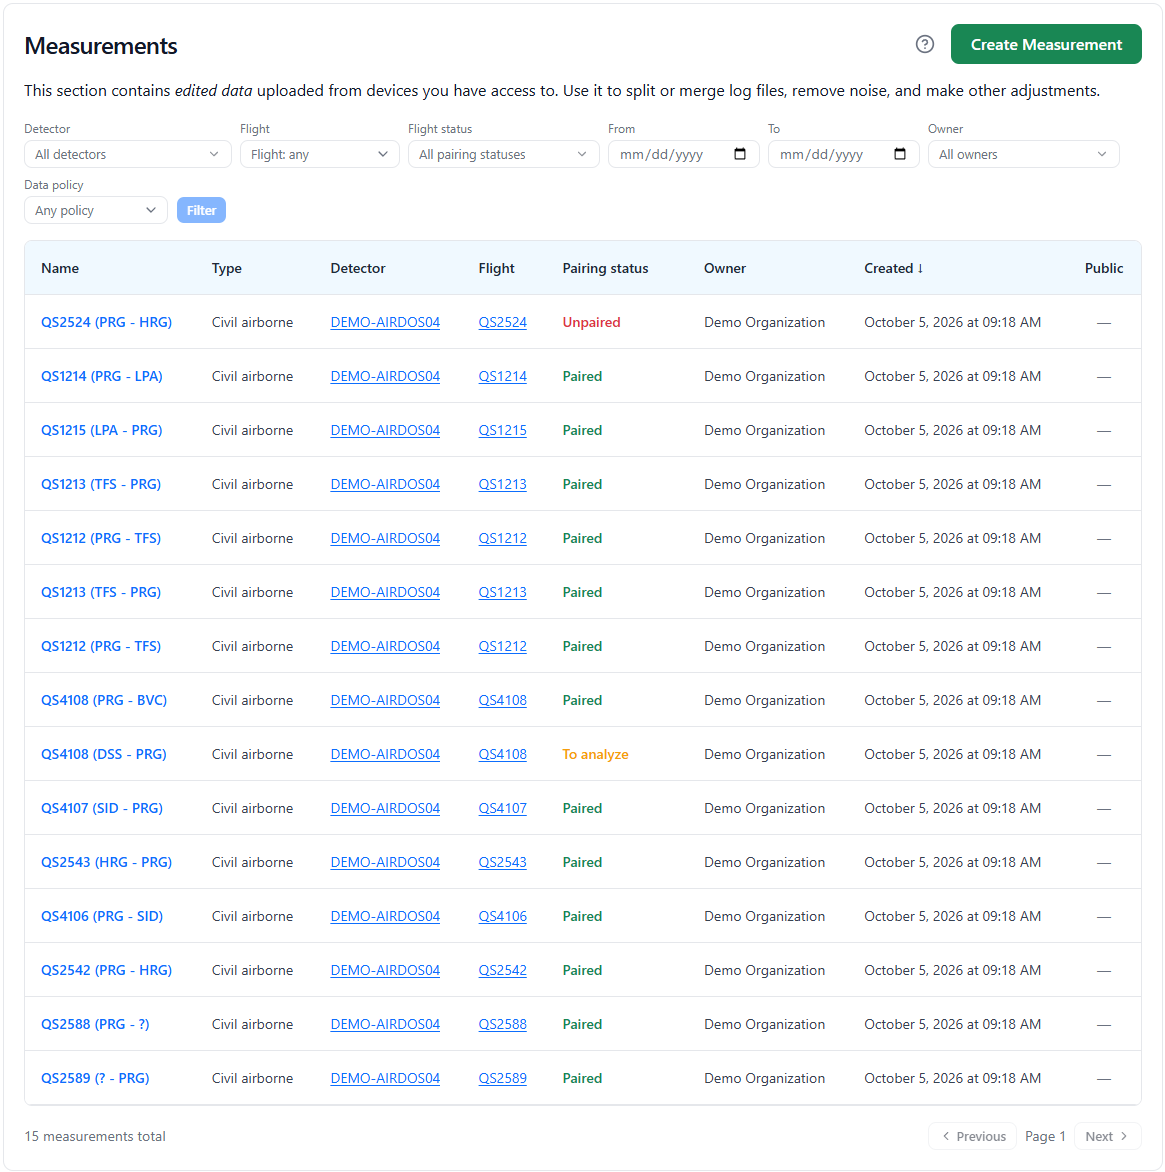 The list of measurements. Each row is one flight, with the detector that recorded it and whether a trajectory has been paired with it.
Every measurement belongs to an organisation, and the organisation decides who else can see it. That lets research groups share their records with each other, analyse them in the same place and build on each other’s flights.
Put together, the shared measurements start to form a global map of radiation at flight altitudes, made of real readings. That is the map the models can be held against. CARI-7, the model commonly used to estimate aircrew doses, will give you a number for any route. DOSPORTAL can put a measured one next to it.
The hardest part: processing the files
Everything above depends on one unglamorous step: reading the file.
Our detectors write a plain-text format (see docs). The AIRDOS, LABDOS, SPACEDOS and GEODOS families all use it, but not identically: an airliner, a laboratory bench and a satellite do not need the same things (see the detector properties here). Every difference costs work, because the parser and every tool on top of it has to be extended and tested.
So why does everything not come out in one format in the first place? Because a uniform format has a price on the instrument side. A new detector can often do something the older ones could not, and using that to the full may mean breaking compatibility. Holding on to compatibility may mean leaving some of the hardware’s potential unused.
This remains a challenge, and one we are actively working on. We are bringing the data from our detectors closer together, and since version 2 each revision of the format is backward compatible with the previous one.
Why it matters
The people who fly for a living receive some of the highest occupational radiation doses there are, and almost all of what we know about those doses comes from models. Models deserve to be checked, and the only way to check them is to measure.
Measuring is the easy half. A drawer full of data is worth little while it sits on one laptop, readable by one script and understood by one person. It becomes useful when anyone with access can open it, see the flight it belongs to and compare it with many others.
That is what DOSPORTAL is for. The drawer comes off the plane, the file goes in, and the measurement ends up next to its trajectory, where other researchers can find it. Reading every detector’s format is still work in progress, and there is more to the portal than fits in one post, including the service history of the detectors. What matters most is simple: DOSPORTAL is a source of measured data that researchers can use in their own analysis.
If you measure radiation on aircraft, or would like to, have a look at portal.dos.ust.cz and the documentation, and get in touch.